
Malnutrition
Definition
As defined by A.S.P.E.N. (American Society for Parenteral and Enteral Nutrition), pediatric malnutrition (undernutrition) is “an imbalance between nutrient requirement and intake, resulting in cumulative deficits of energy, protein or micronutrients that may negatively affect growth, development and other relevant outcomes.”**
Chronically ill and hospitalized patients have an exceedingly higher risk for developing malnutrition, with prevalence rates 24% to 50% worldwide , yet in routine practice only 4% of patients are recognized
Basic Assessment Criteria for Malnutrition:
Any of the following can be indicators of malnutrition, and must be investigated further to deduce if malnutrition exists, severity of diagnosis, and need for consultation/implementation of interventions:
High risk factors including any chronic disease, infection, trauma, malabsorption, malignancy, cystic fibrosis, gastrointestinal disease, neurological impairment
Weight loss or decline in weight gain velocity/inadequate weight gain velocity
Inadequate nutrient intake either via mouth or nutrition support
Fat loss and/or muscle wasting
**Nutr Clin Pract. 2015 Feb;30(1):147-61. DOI: 10.1177/0884533614557642. Epub 2014 Nov 24.
Malnutrition Severity
|
Single data point indicators Weight-for-length or BMI-for-age z-score of ≤ −3 Length/height-for-age z-score of ≤ −3 *MUAC z-score of ≤ −3 |
|
Multiple data point indicators (2 or more) Weight gain velocity (<2 years of age): <25% of the norm expected weight gain for age Weight loss (2–20 years of age): ≥10% of usual body weight Decrease in z-score weight-for-length or BMI-for-age of ≥3 ≤25% estimated energy/protein needs for at least 2 weeks Presence of both fat loss and muscle wasting |
|
Single data point indicators Weight-for-length or BMI-for-age z-score of −2 to −2.9 *MUAC z-score of −2 to −2.9 |
|
Multiple data point indicators (2 or more) Weight gain velocity (<2 years of age): 25%–50% of the norm expected weight gain for age Weight loss (2–20 years of age): 7.5%–9.9% of usual body weight Decrease in z-score weight-for-length or BMI-for-age of 2 to 2.9 26%–50% estimated energy/protein needs for at least 2 weeks Observed/presence of fat loss and/or muscle wasting |
|
Single data point indicators Weight-for-length or BMI-for-age z-score of −1 to −1.9 *MUAC z-score of −1 to −1.9 |
|
Multiple data point indicators (2 or more) Weight gain velocity (<2 years of age): 50%–75% of the norm for expected weight gain Weight loss (2–20 years of age): 5%–7.4% of usual body weight Decrease in z-score weight-for-length or BMI-for-age of 1 to 1.9 51%–75% estimated energy/protein needs for at least 2 weeks Observed/presence of fat loss and/or muscle wasting |
Tips For Documentation
Per national coding guidelines, coders are not permitted to code from Dietitian notes and can only code diagnoses that are specifically stated in the medical record
Diagnosis Document Code:
Look for the “Malnutrition Summary Note” from the Dietitian- includes the degree of malnutrition, clinical indicators, and any planned interventions
Physician to document severity of malnutrition in progress note and add diagnosis to hospital diagnosis list
“Failure to Thrive” codes at the same level as “Mild Malnutrition”
“Severe Failure to Thrive” does NOT equate to “Severe Protein-Calorie Malnutrition”
Documenting “Poor Feeding” and/or “Poor Weight Gain” does NOT equate to a malnutrition diagnosis for the patient.
When documenting, remember:
Severity of Illness (SOI) AND Risk of Mortality (ROM) increase with worsening MALNUTRITION
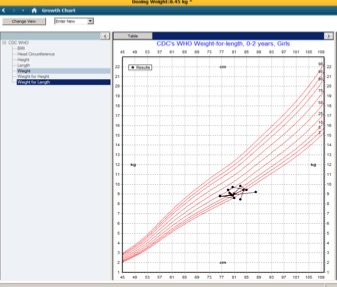
Check MUAC z-scores on Compass growth chart “TABLES” to help assess the degree of malnutrition
*MUAC = Mid-Upper Arm Circumference
Finding a Z-Score
Units of standard deviation from the “normal range”
A statistical measure that tells how a single data point compares with normative data
Found in EMR under growth charts if you click on “Table”. The table will populate the z-score. (Refer to images beside and below to become familiar with the format)

Malnutrition in Neonatal and Preterm Populations
A.S.P.E.N. also published recommendations for indicators of malnutrition in preterm infants and neonates in 2018***. This can be used for term infants ≤28 days or for preterm infants until 42 weeks CGA.
For infants born at 37 weeks gestation and older, recommend use of the WHO growth curve.
For infants born at 36 6/7 weeks gestation and younger, recommend 2025 Fenton preterm growth chart or 2010 Olsen intrauterine growth curves.
***J Acad Nutr Diet. 2018 Sep;118(9):1571-1582. DOI: 10.1016/j.jand.2017.10.006. Epub 2018 Apr 11.
| Indicator | Mild malnutrition |
Moderate malnutrition |
Severe malnutrition |
Use of indicator |
|---|---|---|---|---|
| Decline in weight-for-age z-score | Mild Decline of 0.8–1.2 SD |
Moderate Decline of >1.2–2 SD |
Severe Decline of >2 SD |
Not appropriate for first 2 weeks of life |
| Weight gain velocity | Mild <75% of expected rate to maintain growth |
Moderate <50% of expected rate to maintain growth |
Severe <25% of expected rate to maintain growth |
Not appropriate for first 2 weeks of life |
| Nutrient intake | Mild ≥3–5 consecutive days ≤75% of estimated protein/energy needs |
Moderate ≥5–7 consecutive days ≤75% of estimated protein/energy needs |
Severe ≥7 consecutive days ≤75% of estimated protein/energy needs |
*Preferred indicator during first 2 weeks of life |
| Indicator | Mild malnutrition |
Moderate malnutrition |
Severe malnutrition |
Use of indicator |
|---|---|---|---|---|
| Days to regain birth weight | Mild 15–18 days |
Moderate 19–21 days |
Severe >21 days |
Use in conjunction with nutrient intake |
| Linear growth velocity | Mild <75% of expected rate of linear gain to maintain growth rate |
Moderate <50% of expected rate of linear gain to maintain growth rate |
Severe <25% of expected rate of linear gain to maintain growth rate |
Not appropriate for first 2 weeks of life. May be deferred in critically ill, unstable infants. Use in conjunction with another indicator when accurate length measurement available. |
| Decline in length-for-age z-score | Mild Decline of 0.8–1.2 SD |
Moderate Decline of >1.2–2 SD |
Severe Decline of >2 SD |
Not appropriate for first 2 weeks of life. May be deferred in critically ill, unstable infants. Use in conjunction with another indicator when accurate length measurement available. |